Correlation is a term describing the statistical relationship between at least two variables.
Purpose of Correlation
Correlation is used to determine the statistical dependence of a dependent variable (the one we want to find out) on an independent variable (the one we know or can set). Correlation is often used for estimating the value of the dependent variable, meaning predicting a certain state. It is a simple statistical model of the system.
Correlation can be simple, where we determine the relationship between one independent variable and one dependent variable. This is the most common type of correlation.
More complex are the so-called multiple correlations, describing the relationship between one dependent variable and several independent variables.
There are limitations to correlation due to its nature. Correlation describes only statistical dependence, not causality. There may be no direct relationship between the independent and dependent variables at all.
We can demonstrate the difference between causal and statistical dependence with the following example:
In New York, various factors related to crime were studied, and a strong correlation was found between the number of ice creams sold and the number of burglaries. As the number of ice creams sold increased, so did the number of burglaries. Despite the strong statistical correlation, there is no causal relationship between ice cream sales and the number of burglaries.
Another limitation is that the values of the dependent variable can only be predicted within the range of the independent variable where the statistical dependence was determined. For example, if I measure the air temperature depending on the time of day in June, I can estimate air temperatures at a specific time only for the month of June. I cannot use this estimate for the month of January.
Because correlation determines the so-called statistical dependence, not causal (cause-effect) dependence, it is not possible to determine the value of an unknown parameter with 100% certainty even with a strong correlation.
Practical Application
The examination of correlation can be performed after simultaneously measuring a sufficient number of dependent and independent variables. In the second step, the correlation between the dependent variable and the independent variable(s) is determined. The strength of the correlation and the shape of the relationship are examined. In the simplest case, the relationship between the dependent variable and one independent variable is represented by a straight line. In this case, we speak of a linear relationship. The expression of the relationship is given by the equation of the line in the form y = ax + b, where y is the dependent variable and x is the independent variable.
The correlation coefficient is used to express the strength of the correlation, which takes values from -1 to 1. In practice, its square is often used. If the correlation coefficient is positive, the variables are directly proportional. If it is negative, the variables are inversely proportional. If the coefficient is equal to zero, both variables are statistically independent.
The graphical representation of the relationship is the correlation graph, where the values of the independent variable are plotted on the x-axis, and the values of the dependent variable are plotted on the y-axis. The measured points are then fitted with the so-called regression curve, representing the function of the variables' relationship. Its "accuracy" is expressed by the correlation coefficient or its square. The closer the value of the square is to 1, the more accurately we can determine the value of the dependent variable from the value of the independent variable based on the regression equation. If the correlation coefficient is equal to 0 (its square is also equal to 0), we cannot determine the value of the dependent variable from the value of the independent variable. The dependent variable behaves like a random variable, and its value is not influenced by the value of the independent variable.
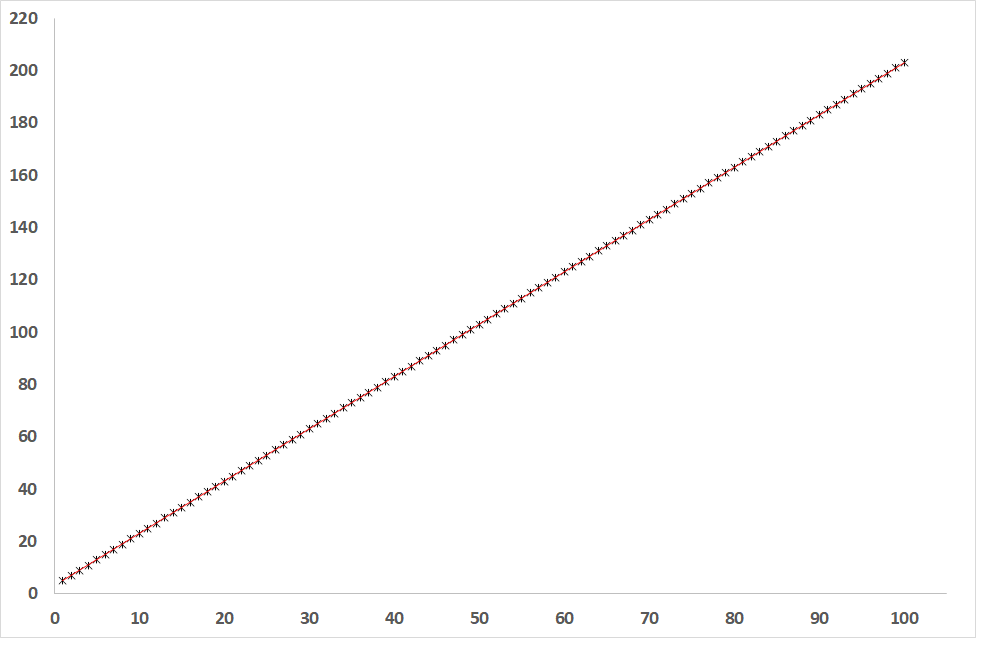
Fig. 1: Dependence of the dependent variable on the independent variable when R = 1 (straight line)
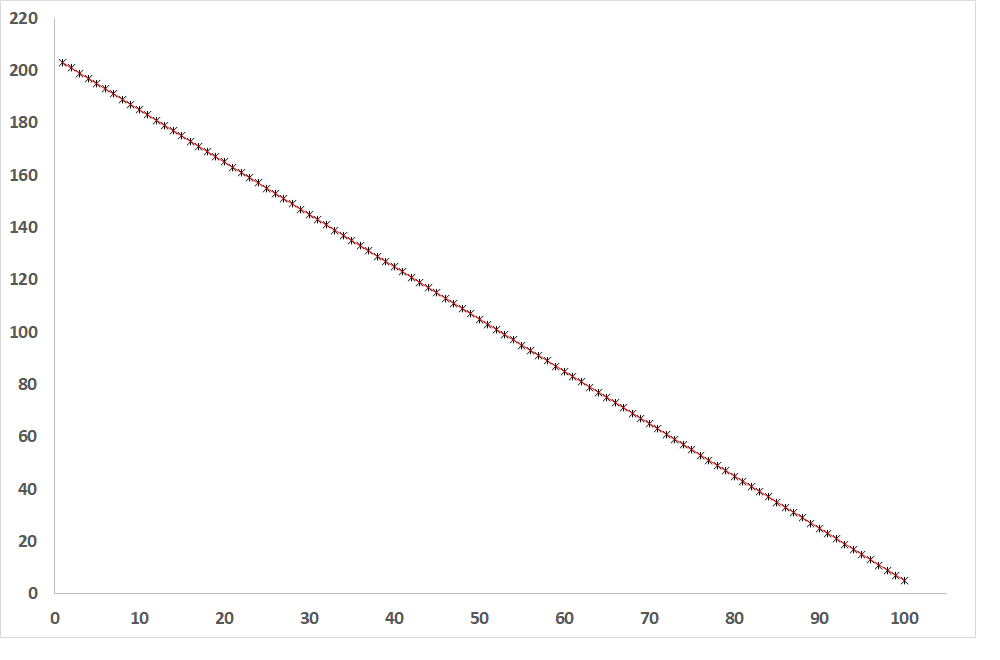
Fig. 2: Dependence of the dependent variable on the independent variable when R = -1 (line of inverse proportion)
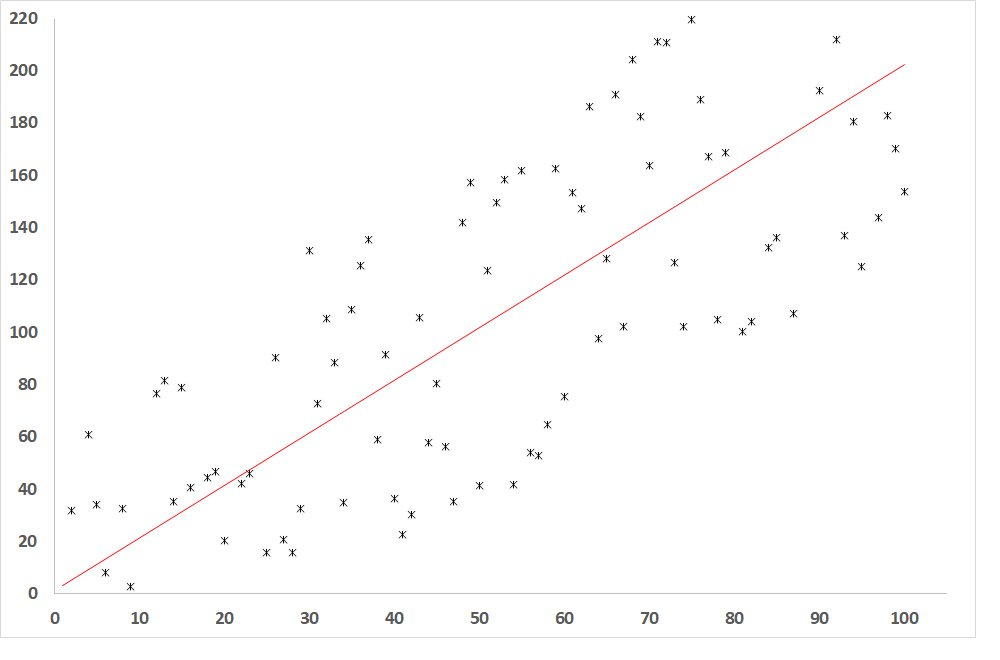
Fig. 3: Dependence of the dependent variable on the independent variable when R = 0.8 (relatively close relationship between the variables)
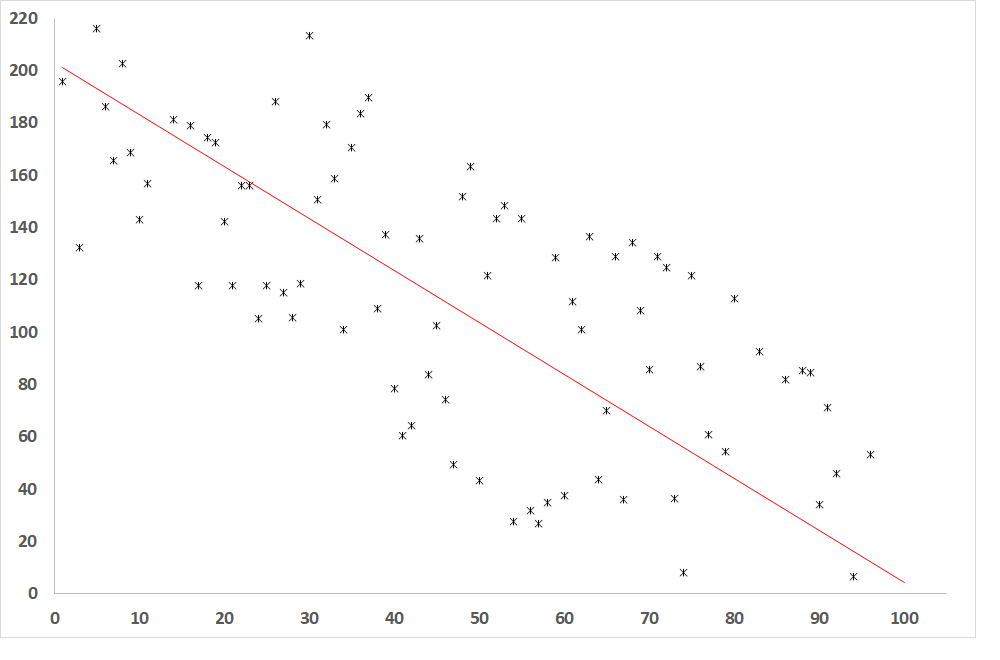
Fig. 4: Dependence of the dependent variable on the independent variable when R = -0.8 (relatively close relationship between the variables)
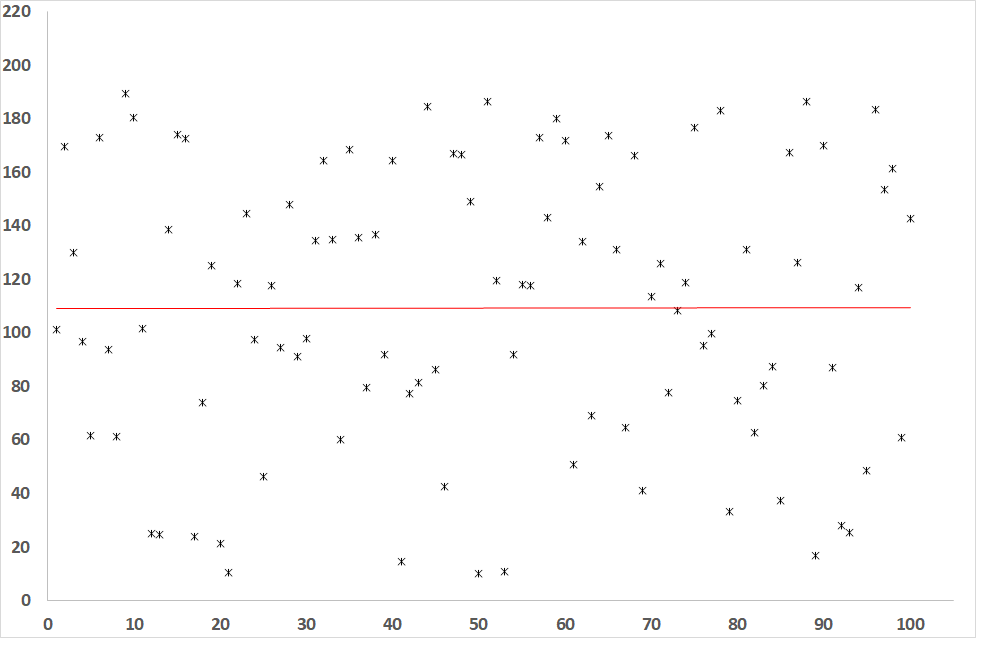
Fig. 5: Dependence of the dependent variable on the independent variable when R = 0 (no correlation between variables)
The issue of correlation is more extensive; this article is a brief summary. For a more in-depth study, we recommend attending some of the training courses provided by our company
Recommended training:
| Training name | Length of training | Available dates | Price | |
|---|---|---|---|---|
| Statistical Process Control – Basics |
1 day
|
03.09.2026
+ 1 available date
|
540,00 €
664,20 € VAT included
|
More about the training |
| SPC II - SPC Troubleshooting |
2 days
|
According to you
|
On request | More about the training |
| SPC III Project of introducing statistical methods in the organization |
2 days
|
According to you
|
On request | More about the training |
| Innovative methods used in the automotive industry and mechanical engineering |
11 days
|
According to you
|
On request | More about the training |