What is an Ishikawa diagram?
The Ishikawa diagram is a representation of the causal relationship between a problem and its root causes. The identified causes can then be eliminated, thereby permanently resolving the problem.
How is the Ishikawa diagram (also known as the Fishbone diagram, Fishbone chart, Cause & Effect diagram, or 4-M diagram) used?
The Ishikawa diagram is a brainstorming tool used to determine the root cause of a problem. Its name is derived from its creator, Kaoru Ishikawa, or from its shape, which resembles a fishbone. It is employed to find causes of a problem that may not be immediately apparent. Root causes are often hidden "beneath the surface" and may not seem directly related to the problem being investigated. By predefining categories of possible causes, their identification is facilitated as the human brain tends to think in categories and systematically.
The analysis using the Ishikawa diagram can be applied to solving any problem that has more than one cause and is within the organization's capacity to eliminate the causes.
How to create an Ishikawa diagram?
The Ishikawa diagram (see the image) is usually filled out in a team to reduce the likelihood of erroneous thinking directions. The analysis can be done formally using prepared forms or informally by drawing the diagram manually on a flipchart or whiteboard, for example.
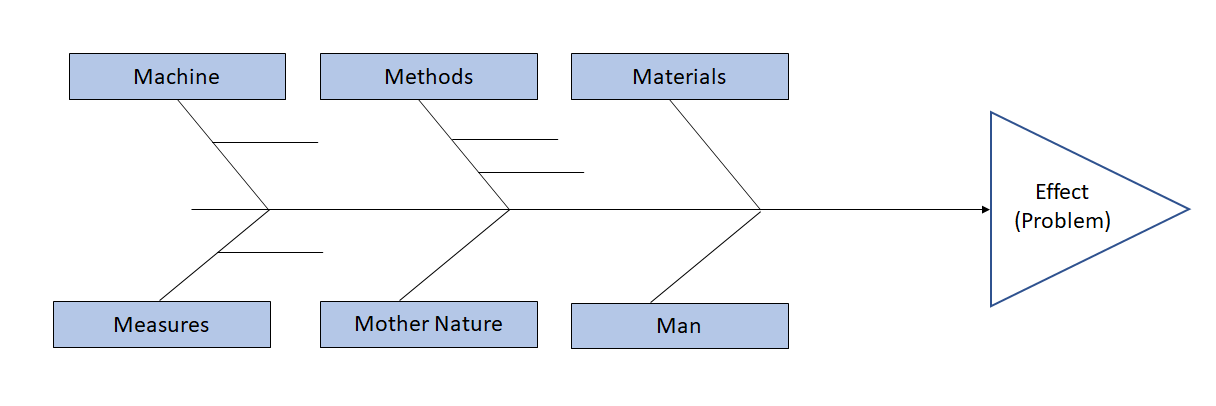
It is important to follow a procedure when creating the Ishikawa diagram. The "head" of the fishbone represents the succinctly analysed problem, i.e., what needs to be eliminated. Under pre-defined categories (usually 4-6 types), the team lists possible causes of the problem. The cause must be clearly named and unambiguous. Although the analysis involves verbal, non-numeric data, the statements presented must be based on observed reality, not impressions. It is essential to consider that the problem is not typically caused by a single cause but by the simultaneous action of multiple causes. Therefore, after the analysis, it is necessary to propose a plan for eliminating all causes.
What are the most common problems with the Ishikawa diagram?
The most common failure in the analysis is citing an unverified fact as the cause. Consequently, corrective actions become ineffective, and the blame is placed on the analysis itself. Another risk is mentioning effects instead of the actual cause. Removing the effects only leads to temporary disappearance of the problem, but if the real cause is not addressed, the problem will inevitably recur in the future.
Properly conducting an analysis using the Ishikawa diagram requires a certain skill, as it is a more complex tool.
Recommended training:
| Training name | Length of training | Available dates | Price | |
|---|---|---|---|---|
| Problem solving |
1 day
|
26.06.2026
+ 2 available dates
|
540,00 €
664,20 € VAT included
|
More about the training |
| Japanese methods of improvement according to TPS (Toyota Production System) |
1 day
|
According to you
|
On request | More about the training |